

Creating a product that truly resonates with users requires a deep understanding of their needs. Design decisions based on assumptions or gut feelings can lead to products that miss the mark. Did you know that 70% of design projects fail due to a lack of user acceptance? This startling statistic highlights the critical importance of data-driven design based on adequate research.
Data-driven design is a systematic approach to crafting user-centric experiences.
In this guide, we'll delve into the principles and practices of data-driven design, exploring how to leverage data to make informed decisions throughout the design process.
What is Data-Driven Design
One of the central tenets of user experience design is that “a designer is not their user.” Despite being a fairly straightforward statement, there’s much more than meets the eye.
Typically, design is something professionals do for other people. This invariably leads to a vast amount of assumptions that designers make while they’re creating a product. Every single assumption has the potential to lead them astray, developing solutions that aren’t very useful to the people they’re intended for. Therefore, in the case of product design, being data-driven means the opposite of arbitrary.
Whenever there’s a need to make a decision, big or small, it’s essential to appeal to data so that we don’t drift away from addressing our users’ needs.
You’d be surprised how often design decisions can be made based on anything other than data: hunches, biases, personal preferences. All of these can’t be entirely excluded from a designer’s work, but they do have to be validated.
Why data matters
Good design is a valuable investment. Creating products from scratch takes a lot of time, effort, and resources. Choosing to bypass research that will allow you to design a better product is a gamble since creating a neat-looking interface isn’t quite enough to address your users’ needs. It’s probably impossible to create a truly usable product without navigating the data you collected from research and analytics.


A data-driven approach allows designers to substantially improve their decision-making, have a crystal-clear understanding of the impact that their design had, as well as adjust and optimize the design in the future.
Data helps accumulate insights and act accordingly. Neglecting to inform your decision with data inevitably results in shooting in the dark with no consistency to speak of.
On collecting data
While the benefits of having access to lots of data are pretty much evident, bad data can be just as dangerous as no data at all. There are plenty of ways to mess the process up—they range from poor execution to selecting inappropriate methods.
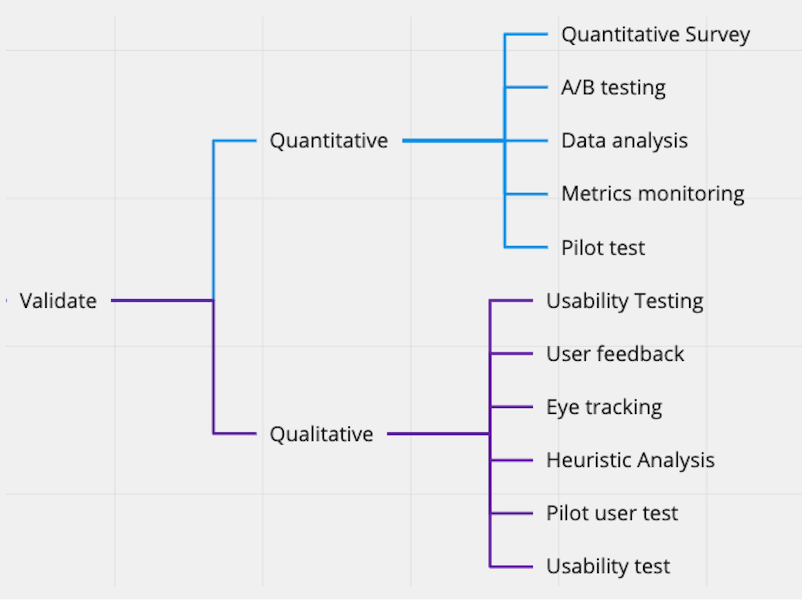
That said, let’s go over the most common and potent ways to collect data. In this section, we’ll go over qualitative and quantitative methods.
Qualitative
Qualitative data is typically expressed in non-statistical means, and it lacks clear structure very often. A qualitative approach doesn’t use hard numbers and, respectively, isn’t commonly expressed in graphs and charts. This kind of data is typically categorized based on properties, attributes, labels, and other identifiers.
Qualitative data doesn’t generally answer questions such as, “How much?” or “How many?”. Instead, it focuses on open-ended questions that explore how people feel about certain things.
This type of data is extremely valuable for generating theories and hypotheses. Here are a few common qualitative research methods:
User interviews
Open-ended surveys


Quantitative
As you may expect, quantitative data deals with hard numbers and is typically very structured. It uses numbers and values to extract insights.
While qualitative research allows for in-depth exploration, quantitative methods are used to extract insight that is more conclusive in nature. Here are a few common quantitative research methods:
Benchmarking;
Web analytics;
A/B testing;


Beware of getting bogged down with data
Sometimes tracking too many things can do more harm than good, especially if your resources are limited. Sure, huge businesses like Airbnb can afford to hire entire echelons of researchers to track and document the tiniest of interactions.
However, for the vast majority of companies out there, analyzing too much data might cause losing focus on the metrics that matter most while wasting valuable time and resources on the ones that aren’t as important.
For instance, a website that has gone live very recently shouldn’t obsess over-optimizing the color of CTA buttons—there will be better times for that. A much better way to move forward initially would be experimenting with the site’s copy and layout. As such, track what matters most within the resources you can allocate to maintain said tracking.
Here are some of the things we recommend to avoid unhelpful research:
Before you start conducting research, study your users extensively. Consult your stakeholders and explore the existing research.
Make a list of things that you, the project team, and the stakeholders want to learn about the users.
Identify the most important data you need to significantly improve your decision-making.
Consider narrowing your research down to your areas of interest in case you’re limited on time and resources. Typically, it’s much better to get a more in-depth understanding of a narrower subset rather than learn a little about a variety of subjects.
On working with stakeholders
From the perspective of key decision-makers such as executives, being data-driven may seem like being slow—that’s totally understandable. Executives often want to see the most results in the shortest amount of time. Anything that can act as an impediment to quicker delivery times can easily be discarded.
As much as we sympathize with executives’ goals, we can’t agree with this line of reasoning. If anything, being data-driven helps you achieve your goals faster since you have numbers & qualitative findings to guide you.
That said, here are a few activities you can do to ease your team’s ways into data-driven design practices:
Talk numbers and value
If possible, use numbers to demonstrate value. On top of that, avoid jargon such as “usability testing” in favor of tangible value such as “fewer support requests" or “better conversion."
Plus, it’s important to note that if your company didn’t have a solid data-oriented culture until now, the transition may take some time and may demand extra effort.
Be extremely clear about the importance of data-driven decision-making in design and other areas. When outlining the specifications for a new product or feature, always underline the most important metrics that specific teams should track closely.
It’s also essential to reward the people that adopt this approach. You may be an employer that can provide praise or tangible financial rewards, but even if you’re a designer in the UX team, you can still reward people by appreciating their effort. This is a process that takes time.
Educate your team
You can’t expect your entire team to be design-savvy. They have as much of an idea of the design process as an average designer has about programming or marketing. That’s why you need to show empathy and communicate what you’re doing and why.
Document everything
A huge part of what makes data work is tracking, experimenting, and reflecting upon the latter. That said, you need an understandable way to document all experiments and activities you’ve conducted. Then, ensure that everyone who’s in any way involved in that data has access to it.
We’ve mentioned previously that it’s important not to get bogged down with research, and companies should focus on the things that matter at this point, but retaining the data with no current use is always a good idea. In the future, this may provide you with meaningful insight.
On experiments in being data-driven
On the most basic level, data is an array of seemingly unrelated bits of information. Processing this information to extract meaningful insight falls on the bright minds of designers, marketers, product managers, and other specialists.
Unfortunately, you can’t afford to aimlessly scroll through spreadsheets and graphs, hoping to stumble upon an insight (while that does happen once in a while).
What you should do instead is be mindful of the experiment you’re conducting. To do that, we suggest following this framework:
Form a hypothesis and the expected outcomes;
Define indicators for success and failure;
Collect data to either validate or invalidate the hypothesis;
Make records;
Reflect;


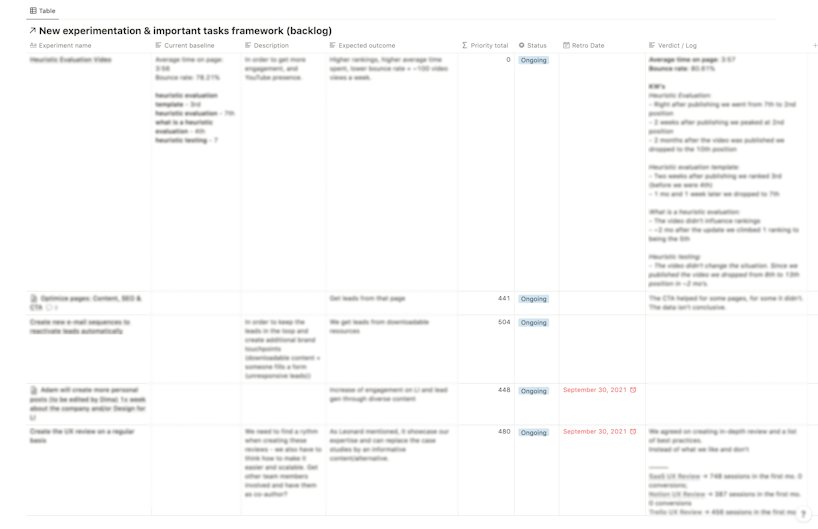
Here's an example of an experiment framework you could use
Ethical considerations in data-driven design
Data-driven design, while powerful, raises important ethical considerations. As designers and developers, we must be mindful of the potential impact of our work on individuals and society as a whole.
User privacy
Balancing Data Collection and User Privacy: It's essential to collect only the necessary data to achieve design goals. Over-collecting data can erode trust and lead to privacy breaches.
Implementing Data Protection Measures: Adhering to regulations like GDPR and CCPA ensures that user data is handled responsibly and securely.
Bias and fairness
Identifying and Mitigating Biases: Algorithms and data can perpetuate biases present in society. It's crucial to identify and address these biases to create fair and equitable designs.
Promoting Diversity and Inclusivity: Designing for diverse users helps ensure that products and services are accessible and relevant to everyone.
Transparency and accountability
Communicating Data Practices to Users: Being transparent about data collection and usage builds trust with users. Clear and concise communication is key.
Establishing Accountability: Designers and organizations should be accountable for the ethical implications of their data-driven decisions.


Tools and technologies for data-driven design
AI has had the biggest impact on data-driven processes. Many powerful tools emerge daily to help us access and analyse amounts of data previously thought impossible.
Effectively implementing a data-driven design requires a robust toolkit. We've written many in-depth articles on the subject. Read our detailed roundup of some of the best AI UX research tools. For market insights, check this one on the best competitive research tools and this on top market research tools.
Here is an overview of some of the key tools and technologies that can help designers create data-driven products.
Research & data analysis tools
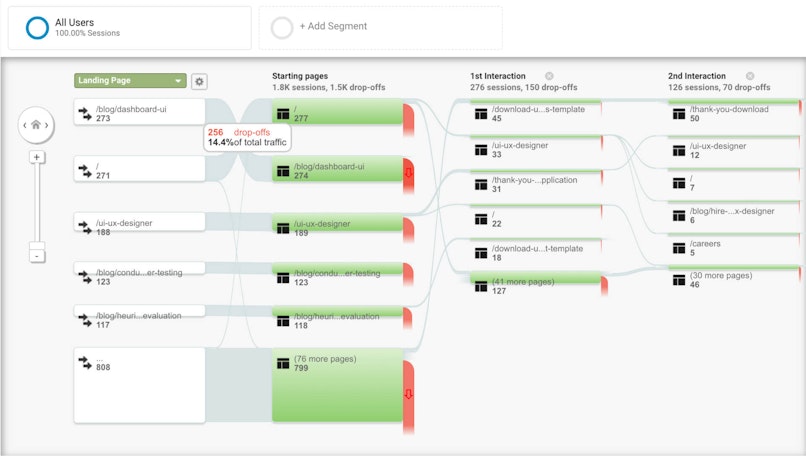
Google Analytics: A powerful tool for understanding website and app user behavior.
Adobe Analytics: A comprehensive analytics solution for measuring digital marketing performance.
Mixpanel: A product analytics tool that helps track user engagement and retention.
Design tools
UX pilot: An AI-driven design tool that covers every stage of the design process.
Figma: A collaborative design tool that integrates seamlessly with data-driven workflows.
Sketch: A popular design tool for creating user interfaces and prototypes.
Collaboration & productivity tools
Miro: A visual collaboration platform that can be used for brainstorming, wireframing, and data visualization.
Notion: An all-in-one workspace for note-taking, project management, and knowledge sharing.
With these AI-powered tools, designers and teams can gather, analyze, and visualize data to inform their design decisions and create exceptional user experiences.
Case studies
Airbnb: A data-driven hospitality revolution
Ever noticed how Airbnb always seems to suggest the perfect place? It's not magic; it's data science. By analyzing your past searches and bookings, they can predict your next dream vacation and tailor recommendations just for you.
But that's not all. Airbnb also uses data to optimize pricing. Ever wondered why prices fluctuate? It's all about supply and demand, and Airbnb uses data to set prices that are fair for both hosts and guests.
And let's not forget that Airbnb constantly tweaks its platform, from the search bar to the booking process. They test different designs and features to see what works best, ensuring a seamless user experience. Ultimately, Airbnb's success is a testament to the power of data-driven design.
Our expertise in data-driven design: Adam Fard case study
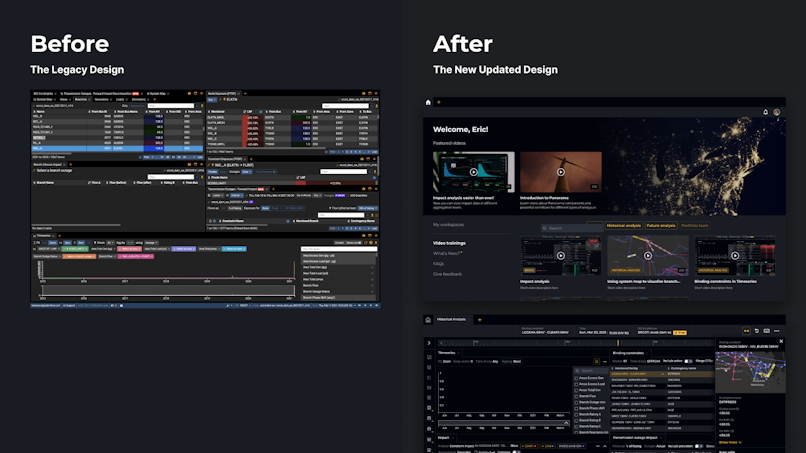
Marginal Unit, a provider of grid congestion modeling and analytics software, faced the challenge of a complex and user-unfriendly platform. To address this, our UX experts embarked on a comprehensive data-driven design project. By conducting in-depth user research, we gained valuable insights into the needs and pain points of users. This information was used to inform the design of a new interface that prioritized clarity, efficiency, and a seamless user experience.
Key Outcomes:
Enhanced User Experience: A more intuitive and user-friendly interface.
Improved Efficiency: Streamlined workflows and reduced task completion time.
Data-Driven Insights: Valuable insights to support informed decision-making.
Increased User Adoption: Higher user adoption rates due to a more accessible platform.
Future-Proof Design: A flexible and scalable design system to accommodate future growth and evolving user needs.


Need data-driven design changes? We can help. Book a free consultation with us today.
Emerging trends in data-driven design
The future of design is undeniably data-driven, with exciting trends on the horizon.
AI
AI and Machine Learning are set to keep enhancing the design process. Automated design tools, powered by AI, can generate design concepts based on data-driven insights. Predictive analytics can forecast user behavior, enabling designers to anticipate future needs and preferences.
IoT
The Internet of Things (IoT) is rapidly expanding, connecting devices and generating vast amounts of data. Designers will need to consider the implications of IoT on user experiences, designing for seamless interactions between devices and humans. Real-time data insights from IoT devices can inform design decisions and optimize user experiences.
Conclusion
Collecting data isn’t the hard part; having a data-driven design process that you’ll stick to probably is. But by leveraging quantitative and qualitative data, you’ll be able to make better decisions and have a real impact on the quality of your users’ experience with the product.