


When it comes to assessing the experience of a product, UX specialists have an entire arsenal of methods to choose from. As diverse as they may be, all these types of tests fall into two major categories—qualitative and quantitative.
While the former revolves around the how and why of an experience, the latter provides us with an understanding of how often an action has been performed, how many users have performed an action, and a variety of other experience parameters that can be expressed in numbers.
This article will focus on the peculiarities of quantitative testing, the value that it provides, and the settings where it’s most useful.
Let's dive right in, shall we?
What is quantitative testing?
Fundamentally, quantitative testing provides designers with an insight into the usability of a product or service.
Most of the time, quantitative usability tests revolve around tasks that users perform while interacting with an interface. This allows designers to collect numeric data about their performance and, as a result, understand the areas of an experience that may require additional attention and, possibly, tweaking. The outcomes of these tests can also be used for reporting and benchmarking.
Of course, the results that quantitative testing yields are often generalized and lack depth compared to qualitative methods, but on the other hand, numbers are much more reliable than subjective accounts.
When should you use qualitative testing?
The rule of thumb when it comes to testing is that qualitative methods are used throughout the entire design process of a product, whereas quantitative methods are used at the beginning of the end of the cycle.
Part of the reason for this distribution revolves around the fact that qualitative methods allow designers to gather a deeper understanding of their user's experience with the earlier iterations of a product, while quantitative methods are useful when they’re looking to confirm or disconfirm theories that arose as a result of qualitative tests. Similarly, they’re useful at the beginning of the design process by allowing to surface trends that can further fuel qualitative research.
Another essential function of quantitative testing is calculating the ROI of a product or its redesign, which allows stakeholders to gather a better understanding of their business needs.
Measuring usability
The purpose of measuring usability is to provide insight into how people interact with your product, which should, as a result, inform the changes that need to be done to better their experience. This ensures that a product is intuitive and easy to use.
Let’s take a look at a few ways quantitative testing can assist in achieving this.
Efficiency
Measuring the efficiency of a task typically revolves around calculating the average time it takes to execute a particular task.
A basic way to find out the time a user needed to complete a task they were presented with is to subtract the start time of the task from the time when they finished working with it.
A significant part of improving a product’s usability is ensuring that basic tasks take less time, since it generally correlates with ease of use and intuitiveness.
Satisfaction
Satisfaction is a critical dimension of user experience and it can be assessed in a quantitative manner as well. Typically, this is done via questionnaires that are provided to users after they’ve participated in usability testing. There are many ways these questionnaires can be structured, here are five of the most commonly used formats:
ASQ: after scenario questionnaire
NASA-TLX: NASA’s task load index
SMEQ: subjective mental effort questionnaire
UME: usability magnitude estimation
SEQ: single ease question
These questionnaires are normally provided to users immediately after they’ve attempted to complete a task, in order to measure usability, i.e. assess how complicated and satisfying they think it was.
Effectiveness
Measuring effectiveness revolves around understanding the accuracy and completeness with which the participants have managed to execute the tasks you’ve provided them with.
This is generally done using two common usability metrics—success rate and the number of errors that occurred throughout the test.
Task success is a metric that expresses the percentage of the test participants that we're able to successfully execute the tasks provided to them. While this is a fairly straightforward metric that doesn’t really provide too much insight on the finer details of a person’s experience while working on the task, it remains a crucial surface-level indicator of usability issues.
Measuring behavior
Understanding the intricacies of user behavior is an invaluable asset for any product. It allows businesses to extract insight into their potential customer's preferences and needs, allowing them to gain a significant competitive edge, retain users, and eliminate a substantial part of guesswork out of their user experience efforts.
A/B testing
This method of testing is exceptionally useful when comparing different versions of an interface or page, in order to identify the one that serves the users’ needs better and provides better overall performance.
This testing method allows organizations to gather lots of data on their most relevant KPIs, like conversion rates, allowing them to make calculated design decisions. This is precisely why big companies like Amazon and Google invest a lot of time and effort into A/B—numbers speak for themselves and conversion rates don’t lie.
Heatmaps
Heatmaps are an awesome tool when it comes to testing multiple prototypes, especially in terms of engagement, clarity, and whether users find them useful. This testing method allows you to understand where users click most, see how far they scroll on your page, and identify the things that catch their attention.


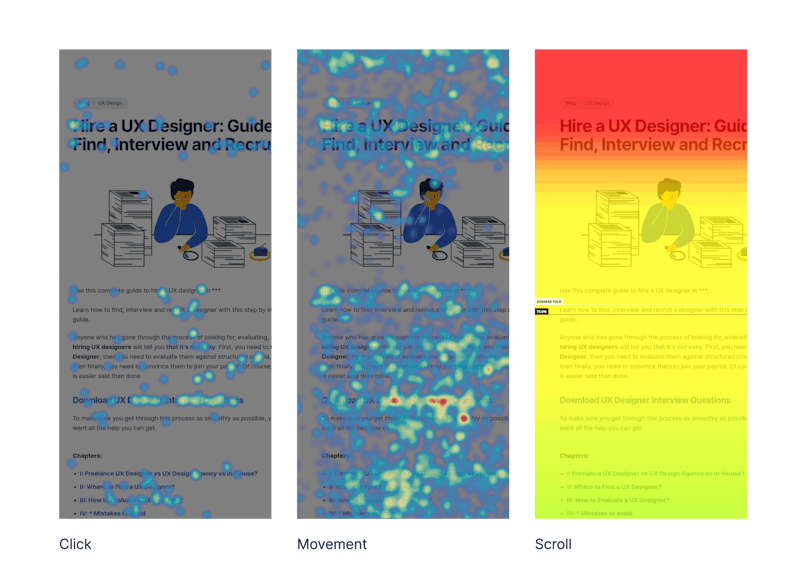
While there’s a variety of heatmaps used across industries, the most common ones are:
Click maps—show the areas where users click or tap on an interface;
Scroll maps— show how far users scroll;
Move maps—show users’ mouse movement on an interface;
Heatmaps are an excellent tool when it comes to:
Understanding what motivates your users to take action;
Ensuring that your CTAs are positioned properly;
Identifying patterns in your users’ behavior on your site;
It’s important to underline that heatmaps generally need a few weeks worth of data to show meaningful results.
Conversion funnels
Conversion funnels allow designers to quantify the percentage of users that complete every individual step of the user journey to reach a particular goal. This is an excellent way to measure the overall performance of your site, allowing you to assess the quality of your user's interaction with the site.
Conversion funnels typically consist of three parts—top, middle, and bottom. Users ascend from the top—the broadest part of the funnel where all the people interacting with your product start their journey—and gradually move down to the bottom as they complete their path.
Naturally, the lower part of the funnel will have less actual customers, as people gradually drop off for one reason or another—which is totally fine. However, businesses should keep track of the percentage of users that drop off throughout their progression through the funnel. High drop-off percentages may suggest that there’s an issue in their interaction with your product, and addressing this can substantially improve their satisfaction with your brand, as well as address a variety of usability issues.
Deep Dive into Quantitative Metrics
Quantitative testing provides valuable insights into user behavior and product performance. And UX designers need to measure key metrics to identify areas for improvement and make sound decisions. In this section, let's go through some of the top KPIs.
Key Performance Indicators (KPIs):
Conversion Rates: This metric measures the percentage of users who complete a desired action, such as making a purchase or signing up for a newsletter. Designers can identify bottlenecks in the user journey and implement strategies to improve conversions by tracking conversion rates.
Task Completion Rates: This metric measures the percentage of users who successfully complete a specific task within a given time frame. Task completion rates help designers identify usability issues and optimize the user experience.
Time on Task: Time on Task measures the amount of time users spend on a specific task. By tracking time on tasks, designers can identify tasks that are too time-consuming or confusing.
Error Rates: Error rates refer to the number of errors users make while interacting with a product. By analyzing error rates, designers can identify usability issues and take steps to improve the user experience.
If UX designers carefully analyze these KPIs, it becomes easier to make data-driven decisions to optimize their products and improve user satisfaction.
User Satisfaction Metrics
In addition to performance metrics, understanding user satisfaction is another important part of improving the user experience. Here are some common metrics used to measure user satisfaction:
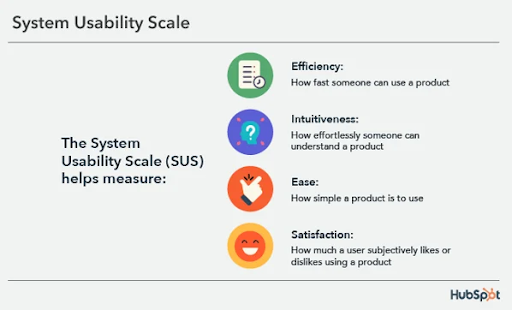
System Usability Scale (SUS): A widely used 10-item questionnaire that measures overall user satisfaction with a product or system. It provides a reliable and efficient way to assess usability.


Post-Task Questionnaires: These questionnaires are designed to gather specific feedback from users about their experience with a particular task or feature. They can include questions about ease of use, clarity of instructions, and overall satisfaction.
Customer Satisfaction (CSAT) Scores: CSAT scores measure overall satisfaction with a product or service. They are often collected through surveys or feedback forms. By analyzing CSAT scores, designers can identify areas for improvement and prioritize user needs.
To gain a comprehensive understanding of the user experience and make informed decisions to enhance product usability, combining quantitative metrics with user satisfaction data is important.
Advanced Quantitative Testing Techniques
Surveys and questionnaires are not all there is to quantitative testing. Other more advanced techniques exist to gather quantitative data. Let's consider them below.
Remote User Testing
Remote user testing allows you to observe users interacting with your product or prototype in real-time, even if they are located remotely. Although typically considered a qualitative research approach, quantitative insights like task completion rates or error rates can be obtained from it.
Best Practices
To achieve the most satisfactory results, here are the best practices to follow while conducting a remote usability test.
Clear Task Scenarios: Develop well-defined tasks that align with your research goals.
Screen Sharing and Recording: Use screen recording tools to capture user interactions and verbal feedback.
Think-Aloud Protocol: Encourage participants to verbalize their thoughts and feelings as they complete tasks.
Post-Session Interview: Conduct a brief interview to gather additional insights and clarify any observations.
Tools and Techniques for Analyzing Remote User Behavior
Not all tools are made equal when it comes to analyzing remote user behavior. Here are the recommended ones to add to your arsenal.
Heatmaps: Visualize user interactions, such as clicks, scrolls, and hovers.
Session Recordings: Review video recordings of user sessions to identify pain points and areas for improvement.
User Surveys and Questionnaires: Gather quantitative and qualitative feedback on specific aspects of the user experience.
User Behavior Analytics: Analyze user behavior data to identify patterns and trends.
Eye-Tracking Studies
Eye-tracking studies provide valuable insights into how users visually interact with a website or app. By tracking eye movements, you can understand:
Areas of Interest: Identify the areas of the screen that users focus on the most.
Reading Patterns: Analyze how users read and scan content.
Attention Span: Measure the duration of user attention on specific elements.
Key Metrics and Insights
Fixation Duration: The amount of time a user spends focused on a particular area of the screen.
Saccade Length and Duration: The distance and time taken for the eye to move between fixations.
Pupil Dilation: Changes in pupil size can indicate emotional arousal or cognitive load.
Eye-tracking data can help designers optimize the visual hierarchy of their designs and improve the overall user experience.
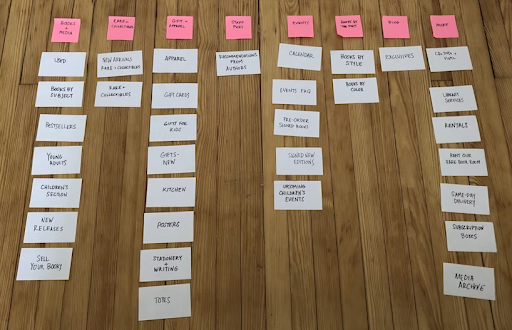
Card Sorting
Card sorting is a fun technique used to understand how users categorize and organize information. It's particularly useful for information architecture and navigation design.
Best Practices for Conducting Card Sorting Studies
Open Card Sort: Participants are asked to group cards into categories of their own choosing.
Closed Card Sort: Participants are given predefined categories and asked to sort cards into the appropriate category.
Hybrid Card Sort: Combines elements of open and closed card sorting, providing a flexible approach.


The results of card sorting studies can lead designers to create intuitive and user-friendly information architectures that help users find what they need quickly and efficiently.
Integrating Quantitative and Qualitative Research
For the most optimal results, UX designers have to combine both qualitative and quantitative data. This offers a more comprehensive view of the problem and how to implement an effective solution.
Triangulation
Triangulation involves using multiple methods to study a phenomenon from different angles. When you combine qualitative and quantitative research, you can triangulate your findings and increase the credibility of your conclusions. For example, you might use a quantitative survey to identify general trends in user behavior, and then follow up with qualitative interviews to explore specific user experiences in more depth.
Iterative Design
Iterative design is a cyclical process that involves continuous testing, analysis, and refinement. By integrating qualitative and quantitative research, you can identify areas for improvement, implement changes, and then re-evaluate the impact of those changes. This iterative approach helps you create products and services that meet the evolving needs of your users.
Bottom line
Quantitative testing is a vital part of ensuring the usability of your product. While it may lack the detail and depth of qualitative data, it remains critical when it comes to validating theories and establishing bigger picture trends and patterns.