User experience design has proven to be a vital tool in the inventory of companies of all sizes. Every dollar invested in the betterment of a product’s experience yields a staggering return on investment (ROI). However, it’s also true that calculating the returns that UX generates is a notoriously intricate task since it’s very complicated to tie experience to complex quantitative data.
However, we’re confident that with the article we’ve prepared for you today, you’ll be able to back your business’s UX efforts with hard data. Below, we’ll discuss a wide array of metrics, along with a series of caveats associated with ROI tracking and some benchmarks you can follow.
Let’s dive right in, shall we?
What’s ROI?
Return on investment, also known as ROI, is a standard financial indicator that is meant to assess the relationship between an investment and the benefits that it reaped. As a discipline, user experience design intends to ensure the satisfaction of both user and business needs, and ROI is a way to quantify the extent to which a company can meet its goals via UX.

How to Measure ROI on UX Activities
Given that organizations have different business models and exist in different markets, the key performance indicators (KPIs) they use to calculate ROI will differ significantly.
The KPIs that will be used to calculate the efficiency of UX efforts are often defined at the beginning of product development. Still, it’s important to underline that it’s nearly impossible to know for sure which indicators will end up being the most important this early on. Once said product hits the market, a company will have access to a wide array of metrics that they can leverage to understand whether their investment in user experience has aligned with its expectations.
Below, we’ll look into a variety of metrics that are commonly used to estimate the return on investment of UX.
Conversion rate
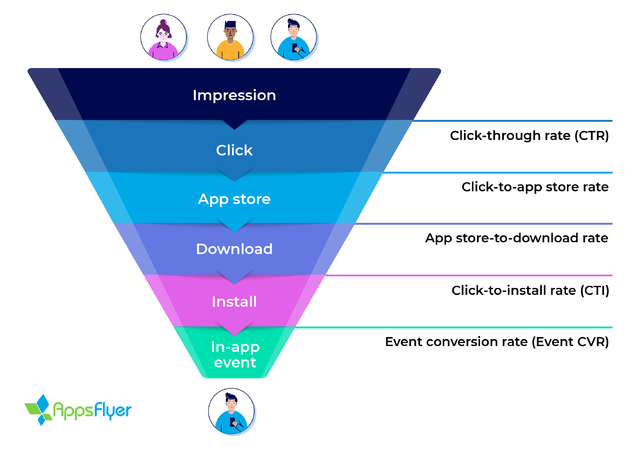
Conversion rates are considered to be among the most important metrics when it comes to evaluating sales success. It represents the percentage of desirable actions performed by users in proportion to the total number of times they’ve interacted with the product within a certain timeframe. Conversion rates can be applied to anything from purchases to subscriptions and beyond.

Drop off rate
This metric reflects the percentage of times your users have ceased interacting with a particular part of your product. It allows designers to identify the areas of a product’s experience that users might find confusing or that cause too much friction, which makes them drop off.
Single usability metric (SUM)
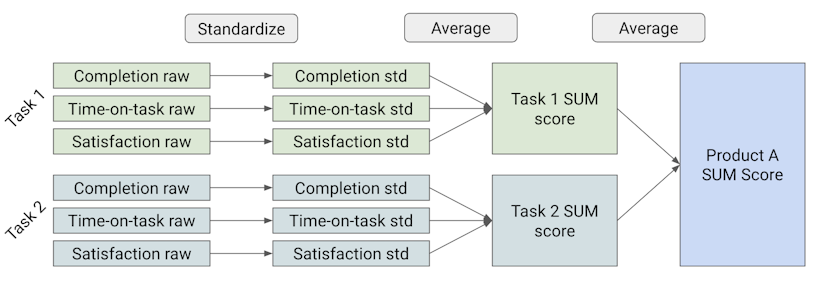
While usability is a reasonably standardized requirement created on a set of clear principles, it’s not really that simple to calculate it. To do that, businesses rely on the outcomes of both good and bad experiences. SUM is a compound of multiple metrics like bounce rate, completion rate, satisfaction rate, and so forth. It’s important to mention that your single usability metric isn’t meant to replace all of its component metrics. Instead, it aims to provide you with a birds-eye view of the quality of your experience.
The most straightforward way to calculate your SUM is to take a geometric mean of its component metrics. Here’s an example of a possible formula:
√(Bounce rate + Task-level satisfaction Rate + Completion rate)

Average order value
While the average order value and your conversion rate may seem strongly correlated from a UX perspective, there’s a difference in how designers should approach them.
Typically sales pages are created with the intention to guide the user to checkout as soon as possible. As a result, this allows an increase in the conversion rate. When attempting to boost your average order value, your approach will differ. To increase AOV, a designer should focus on pulling users deeper into the website rather than rushing them to the checkout page.
It’s also important to underline that this approach should be pursued with caution since it isn’t optimal for the overall user experience.
To calculate your average order value, divide your overall revenue by the number of purchases made.
User retention rate
User retention strongly relies on user experience. Ensuring high retention rates will benefit your product from a wide array of perspectives—it will boost both conversion rates and average order value, but also help decrease your marketing expenses.
In order to calculate your user retention rate divide the number of users at the end of a timeframe (month, quarter, year, etc.) by the number of users at the beginning of the same timeframe. Multiply that by 100 to express this metric as a percentage.

Support Cost per User
They say that good design is like a joke—if you need to explain it, then it probably isn’t that good. One of the fundamental goals of UX design is to create experiences that are intuitive and accessible.
An experience that demands a lot of explaining and support may have a significant toll on the product’s support team. As a result, this can both incur significant expenses to grow the support team due to high demand and harm a customer’s experience with the product.
Reduction in training
Most of the products on the market will probably not need in-depth documentation; a proper onboarding experience should suffice. However, it’s an essential part of any complex SaaS or B2B product.
Therefore, ensuring that your supporting documentation is provided in a clear and coherent manner is vital for your users’ experience.
The Caveats of ROI Tracking
We mentioned previously that tracking UX ROI isn’t the most straightforward task—and it’s time for us to take a look at the reasons why.
Money isn’t always the issue
Of course, the central idea of ROI is the actual “return” on the investment made, and more often than not, it’s expressed as a sum of money. Problems arise when people obsess over establishing the dollar value of certain changes in a product’s experience.
It’s not always easy to achieve this because it’s hard to explain how the ease of use and overall satisfaction of a person’s experience can be quantified financially. Focusing on revenue exclusively is reductive since UX doesn’t just regard the bottom line; it also has a substantial impact on more subtle business goals.
You can’t track things perfectly
It’s crucial to underline that even if you manage to put a number on your ROI, chances are that it’s not all that precise. There are two central reasons for that.
First off, whatever number you arrive at is but an estimate—and most probably, it will be that in the vast majority of cases.
Secondly, ROI calculations don’t take into account employee efficiency, which always tends to fluctuate. Business owners often expect that by investing in UX, their designers, developers, researchers, support representatives and other personnel will be able to perform more tasks in the same amount of time due to user experience improvements. There’s no way to control or predict that. People might use their extra time to unwind rather than reinvest it into work.
You don’t have to get bogged down by details
Another extra factor to why calculating ROI down to the cent is either extremely (and unnecessarily) labor-intensive or generally imprecise. Suppose you’d want to calculate the true return on investment of your user experience efforts. In that case, you’d have to calculate every single factor, down to the amount of money you’ve paid for electricity for the UX team alone.
How to maximize the UX ROI
Now that we’ve calibrated our expectations regarding the precision of a potential UX ROI report, let’s get down to a few straightforward yet critical recommendations. Below, we’ll explore a few ways you can get more bang for your buck from your user experience efforts.
Stick to the process
Skipping over entire phases of the UX design process will invariably result in the sabotage of your success. More likely than not, you’ll end up with a half-baked product that will need to be redone sooner or later. That’s not a formula for a good ROI.

Hire professionals
The same applies to the people you hire. Getting a jack-of-all-trades freelancer or a “suite” agency is risky. It’s likely the UX activities won’t get the attention they deserve, resulting in poor ROI.
Involve UX designers early
Here’s a story we’ve heard far too often for our comfort: we’ve built the product ourselves and now need someone to “boost” the UX. Unfortunately, this is not how UX works. Again, it’s a methodical process, not just something you “add” on top of a product and call it a day.
A few industry benchmarks
While most businesses operate in their own way due to the sheer diversity in their structure and operations, it’s essential to follow a general template when calculating the ROI of UX. Quite possibly, you’ll make some adjustments to the process so that it suits your product better, but make sure not to deviate from the industry standard by too much. On to the benchmarks!
Choose what to measure
Depending on your product’s design and experience, you’ll have to choose suitable metrics that will reflect their quality. Take a closer look at the indicators that best represent your business goals. To these, add metrics that would reflect the quality of your product’s top tasks.
Decide how to measure
Deciding how to measure is as important as choosing what to measure. More importantly, it’s essential to commit to the rigor that your research method requires. If your company doesn’t have employees with the necessary expertise in measuring user experience, reach out to a consultant, or consider hiring a person with said skillset. Bad numbers are far worse than no numbers.
Collect the first measurements: establish baselines
It’s essential to establish what are the baselines you’re going to compare your findings to. This will allow you to understand whether you’ve successfully improved the experience of your product or not. If you haven’t previously collected such data and have no reference to use, consider going with industry-wide benchmarks.
Redesign the product
This is where the design work commences. Your team of UX specialists will work their magic on the current iteration of the product to improve its usability and overall experience.

Collect additional measurement
After the redesign is complete, it’s time to go back to the metrics you’ve chosen to track and the baselines you’ve defined for them. Measure continuously, especially if you’re working with analytics. However, bear in mind that when it comes to tracking task-based performance, it’s a good idea to choose the right time to document the data. Naturally, substantial changes in a product’s UI will slow users down as they’re trying to adapt.
Interpret findings
Now that your data is collected, it’s time to make sense of the information you’ve gathered. Take into account that this step needs to be made with a fair amount of statistical rigor. Depending on the size of your data set, you’ll see a lot of noise that has little impact on the actual quality of your product’s experience.
Calculate ROI
Establishing the baselines for your measurements is instrumental when it comes to demonstrating the value of user experience design, as well as calculating its ROI. Look for opportunities to find causality between the changes that have been done and the improvements in your business processes that have led to growth in revenue.
Parting thoughts
UX design is all about your users’ needs. However, that by no means discounts the importance of organizational goals. By attempting to be extremely thorough with calculating the ROI of your UX efforts, you might be opening yourself up for an unnecessarily arduous task that may not really pay off in the end.
UX ROI is about estimating the value your organization will acquire by providing a better product to your users.


